
The Dashboard’s charts
Overview
The charts on the Dashboard show how your shop is doing. They show paid orders by week and by channel, fulfilment, top products, returns and each location. Shop owners and managers use them to see what sells and where.
Before you start
You need a role that can read orders, such as Shop manager.
Amounts in rand show only for a role that can see payments. Without it, the charts show counts only.
Read how the shop is doing
Open the Dashboard
In the sidebar, select Sell › Dashboard. Go to How the shop is doing.
Set the period
Select 7 days, 28 days or 90 days. Each chart compares the period with the period before.
Read a chart
Point at a column, a slice or a bar. A tooltip shows its value.
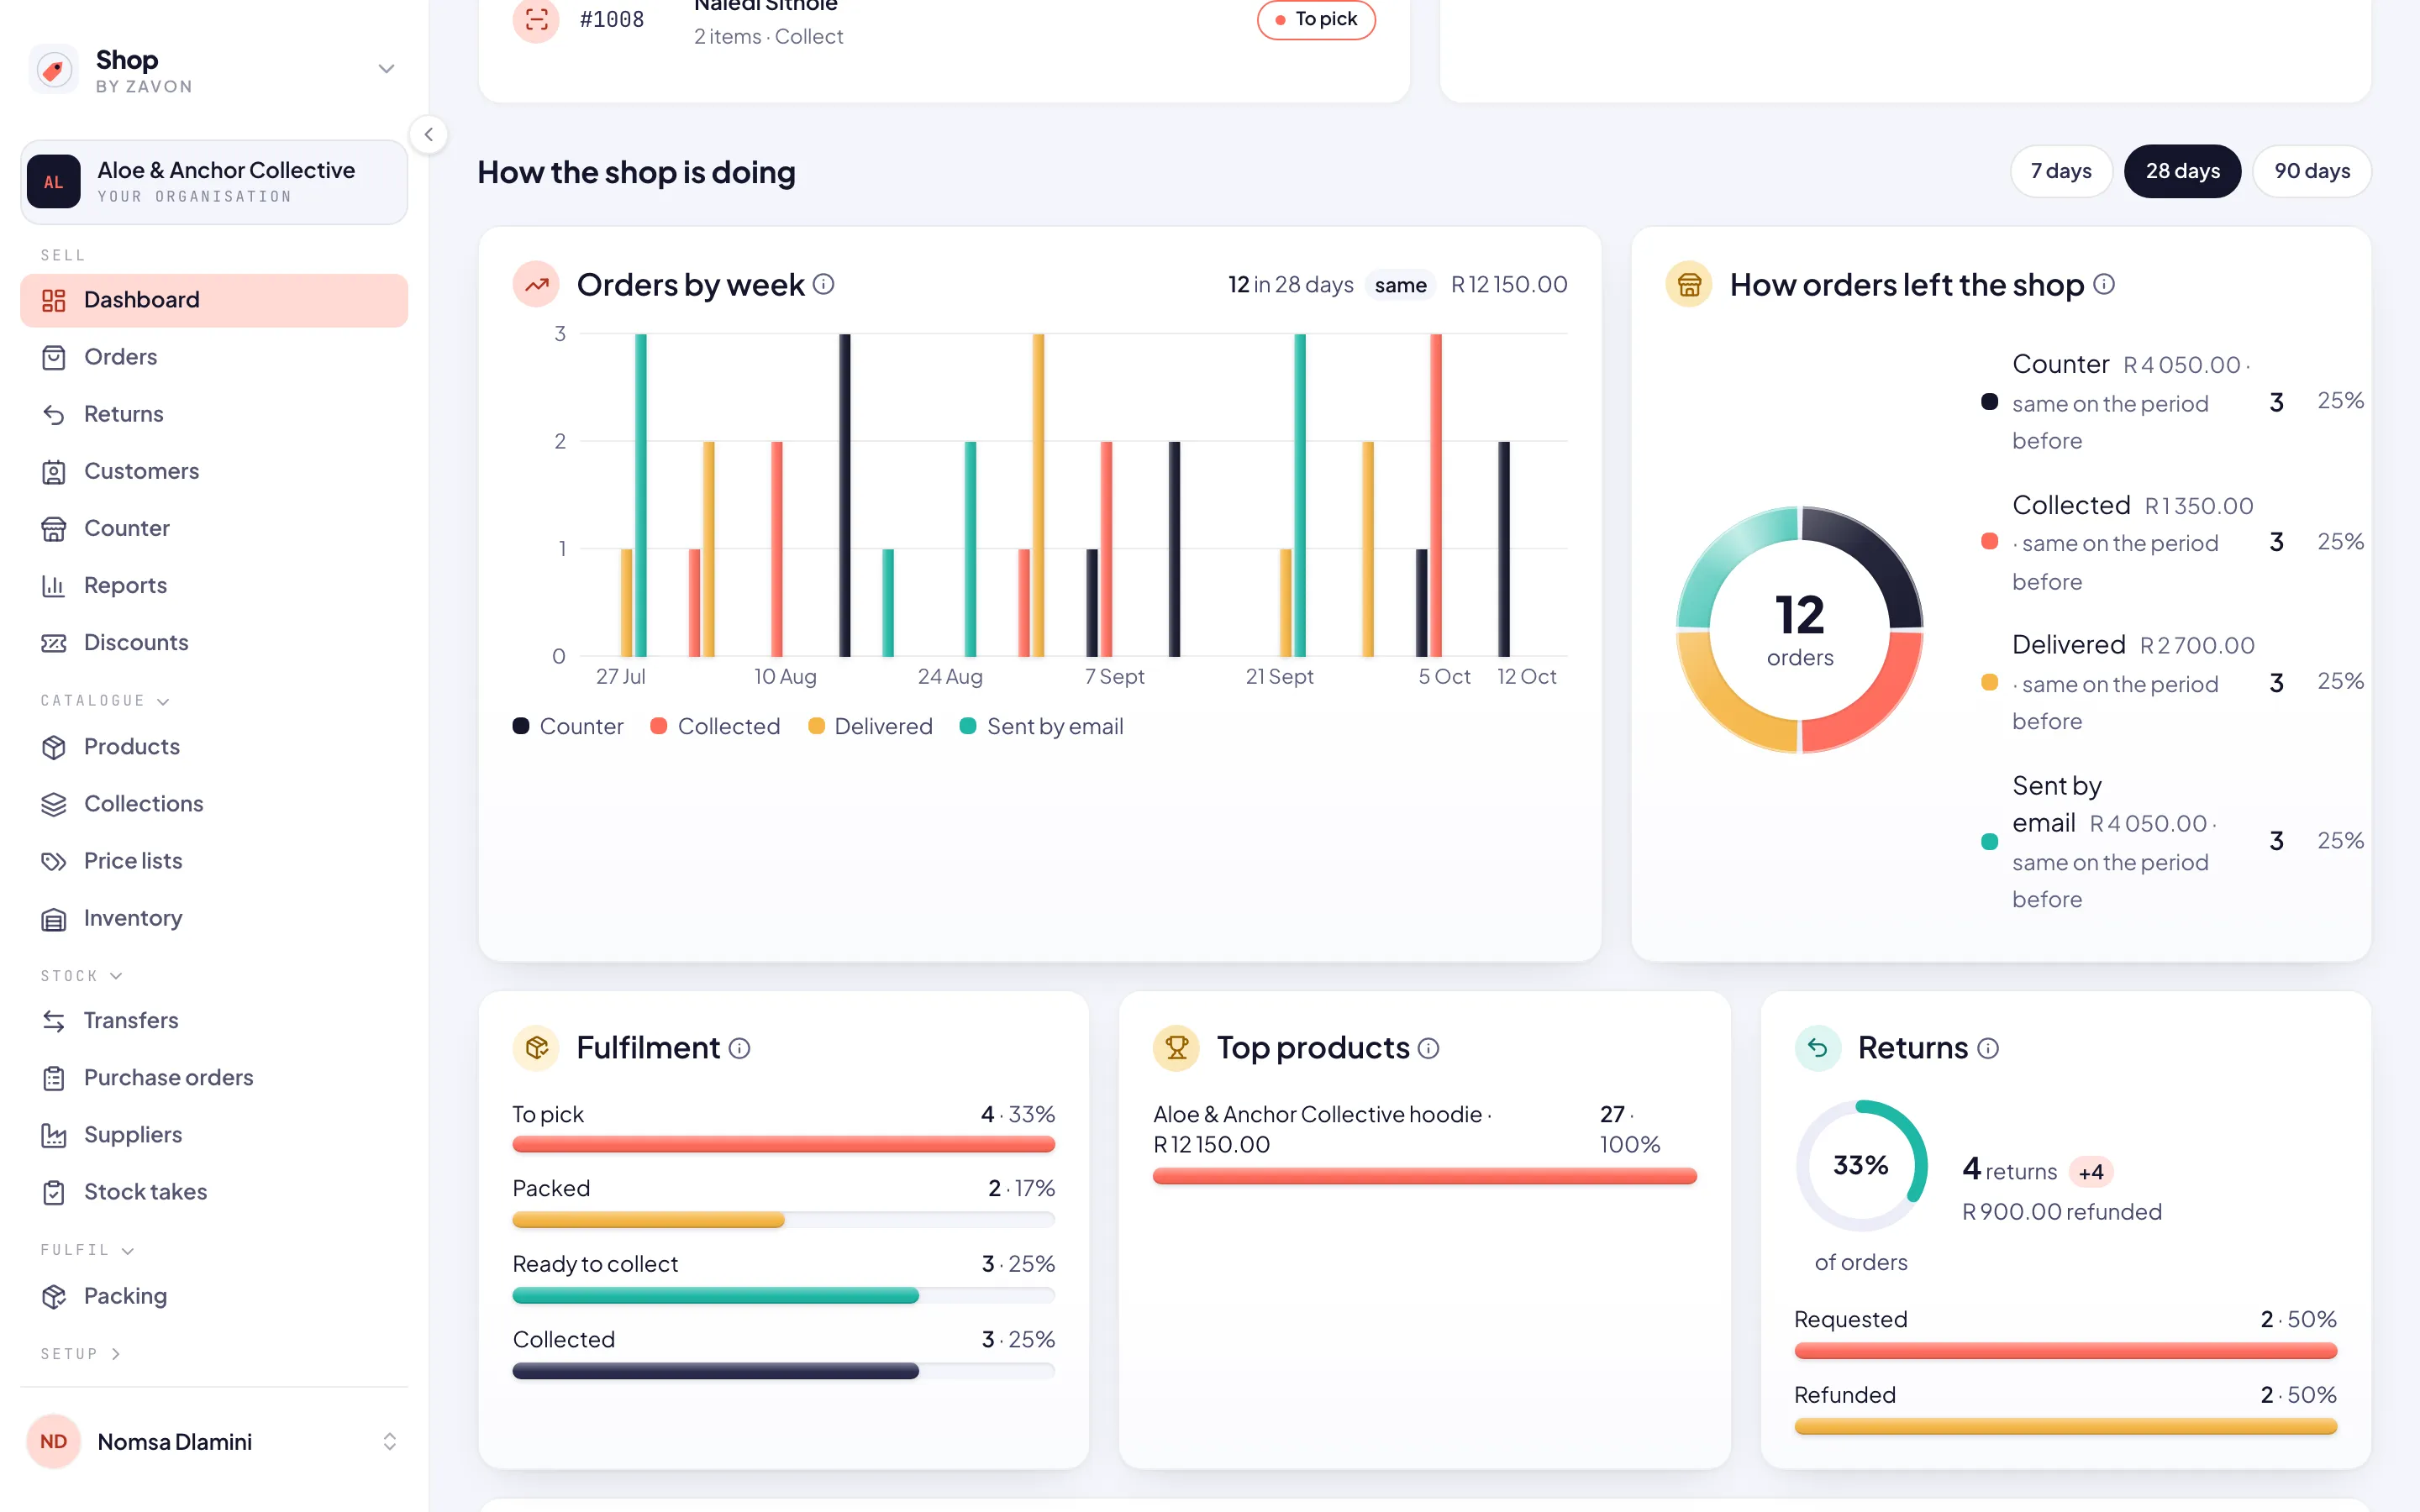
The charts
Orders by week. Paid orders in each of the last twelve weeks, split by how they left the shop.
How orders left the shop. Paid orders by channel: Counter, Collected, Delivered and Sent by email, with the change against the period before.
Fulfilment. Where the orders of the period stand now.
Top products. The products sold most in the period, by units.
Returns. Returns asked for in the period, where they stand, and the change.
Locations. Each location’s paid orders, split by channel, with their value and the change.
Troubleshooting
If a chart shows No paid orders in the period., select a longer period.
If no amounts in rand show, your role cannot see payments. Ask a Shop manager for that permission.
Good to know
Channels. Shop reads the channel from the delivery method. A sale at the counter is Counter, a collection is Collected and a download is Sent by email. Everything else is Delivered.
Paid orders only. The charts count paid orders. Unpaid orders show at the top of the Dashboard.
Fulfilment: find orders, pack them and handle returns.
Point of sale: sell at the counter.
Shop: getting started: the sidebar and the checklist.