
Dashboard
Overview
The Dashboard is the first screen after you sign in to Pages. It shows trends for the last 30 days, the week ahead, and counts across your organisation.
Before you start
Every user of Pages sees the Dashboard. Each chart shows only the figures that your role can see. Revenue needs permission to see payments. See Roles and access.
Read the trends
Open the Dashboard
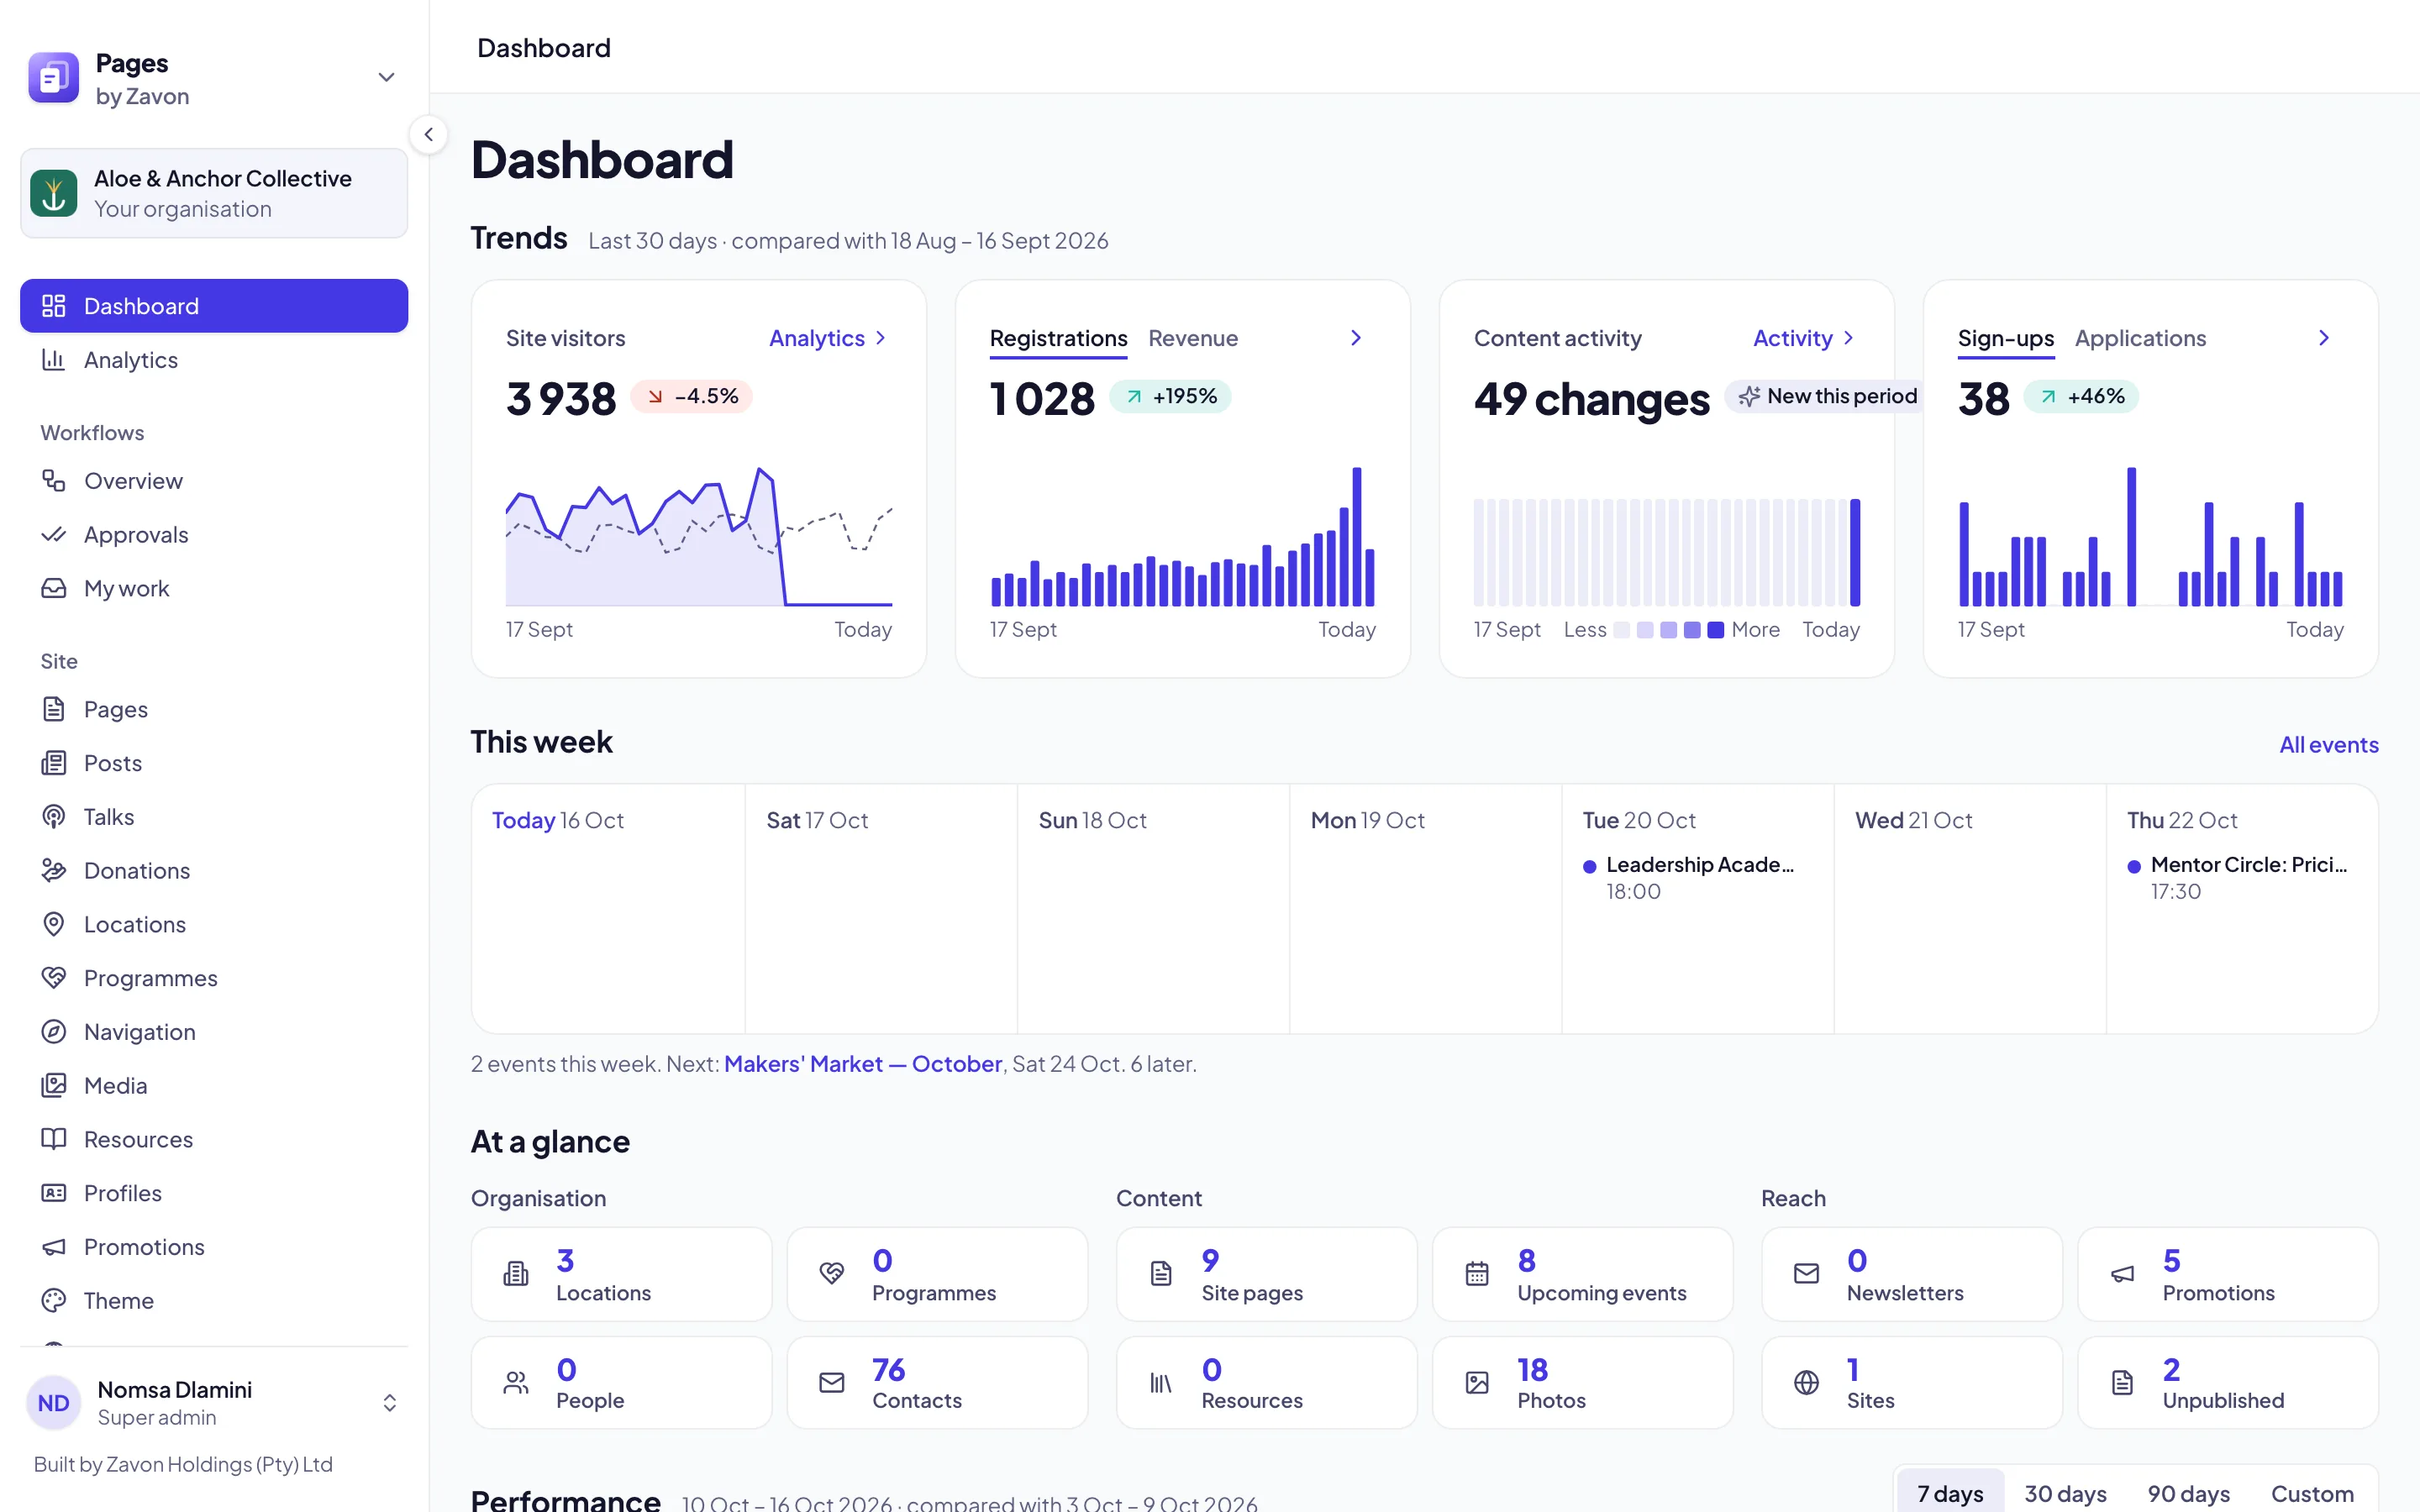
In the sidebar, select Dashboard. Trends compares the last 30 days with the 30 days before.
Read a chart
Read the total and the change badge of each chart. On Site visitors, the dashed line is the period before.
Switch a chart
Select Revenue beside Registrations, or Applications beside Sign-ups. The chart changes.
Read it day by day
Use the Tab key to go to a chart. Then use the arrow keys to read each day.
Open the screen
Select the link at the top of a chart, such as Analytics or Activity. Its screen opens.
The rest of the screen
Content activity. A strip of the last 30 days. A darker day had more changes to pages, posts, events and other content.
This week. Seven days from today, with up to two events a day and the number of others. Each event links to its people. Select All events to see the whole list.
At a glance. Counts of your locations, programmes, pages, events, photos, contacts and more, grouped under Organisation, Content and Reach.
Performance. Site traffic for 7 days, 30 days, 90 days or a Custom period.
Troubleshooting
If a chart is not on your Dashboard, your role cannot see its figures.
If Site visitors shows no line, no visits were recorded in the last 30 days.
If a part of the Dashboard could not load, reload the page.
Good to know
Visitors are counted per day. Pages does not recognise a visitor from one day to the next. A visitor who comes back on three days counts three times.
Pages: getting started: find your way around the console.
Add an event and sell tickets: the events in This week.
Filter lists: narrow the lists that the Dashboard links to.