
Analytics
Overview
Analytics shows how people use your public site: visitors, page views, the pages they read and where they came from. Each figure compares the period with the one before. Communications teams use it to see what works.
Before you start
Your role needs Read on Analytics. A role limited to some locations sees the pages of those locations only. See Roles and access.
Visits are counted only for visitors who accept analytics on your site’s privacy banner.
Read the report
Open Analytics
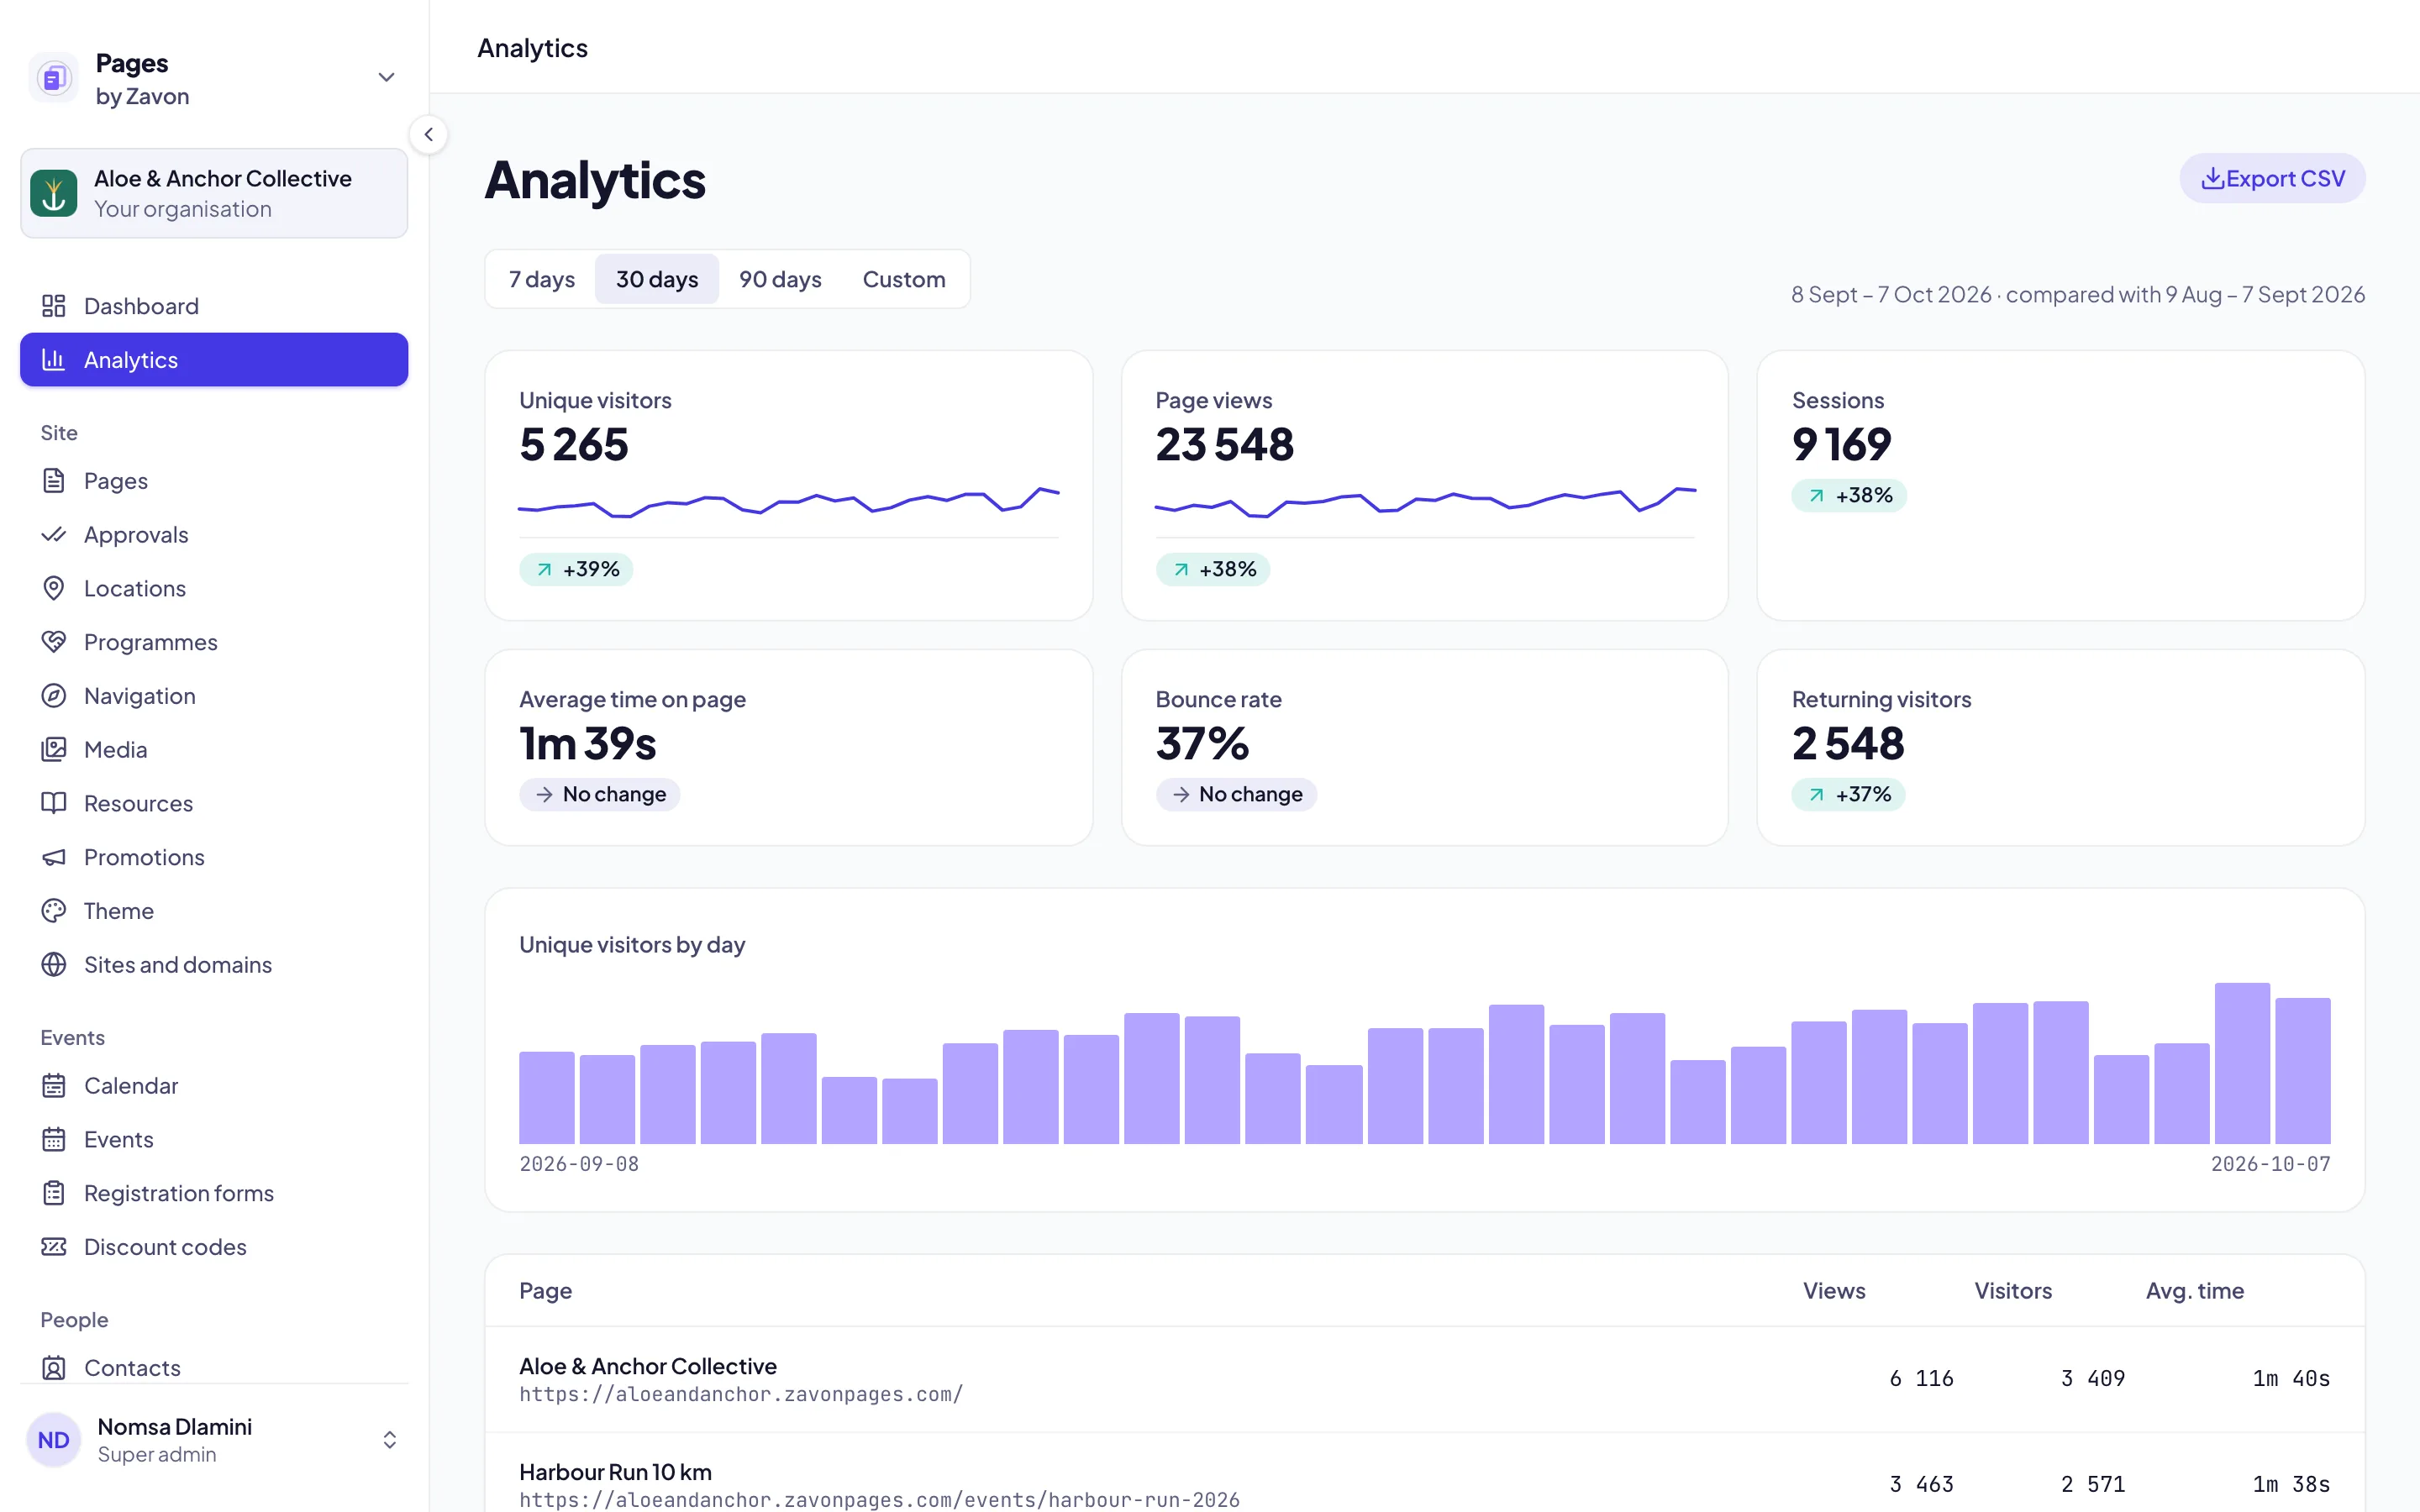
In the sidebar, select Analytics. The report for the last 30 days opens.
Select a period
Select 7 days, 30 days or 90 days. The line beside it says which period each figure is compared with.
Set your own dates
Select Custom. Set From and To.
Read a figure
Point to a figure’s name to read how it is counted.
Read each page
Read Pages for each page’s views, visitors and average time. Select a page to open it on your site.
Export
Select Export CSV. A file of the whole report for the period downloads.
What is counted
Unique visitors. Counted per day. Pages does not recognise a visitor from one day to the next, so a visitor on three days counts three times.
Page views. Each page a visitor opens, including a reload and a return with Back.
Sessions. A visit in one browser tab. It ends after 30 minutes without a page view.
Average time on page. The time a page was visible and in use. Idle and background tabs do not count.
Bounce rate. Sessions that viewed a single page, as a share of all sessions.
Returning visitors. Visitors with more than one session on the same day.
Enquiries and Leads. Enquiries counts every contact-form enquiry. Leads counts the enquiries from visitors who accepted analytics.
Sources, Campaigns, Devices and Countries. Where visits came from, the utm_source of campaign links, and the devices and countries of page views.
Troubleshooting
If the screen says no visits were recorded, no visitor accepted analytics in the period. Select a longer period.
If the figures seem low, many visitors did not accept analytics. Their visits are not counted.
If a notice says the figures cover the pages of your locations, your role is limited to some locations.
If the analytics could not be loaded, reload the page.
If Export CSV is grey, the report is still loading.
Good to know
Privacy. Pages sets no analytics cookie and does not keep visitors’ IP addresses. Visitors who decline, or whose browser asks not to be tracked, are not counted.
Not counted. Search engine crawlers, link previews and the console itself are not counted.
Days. Days run on South African time.
The Dashboard. The Dashboard shows the same visitors for the last 30 days. See Dashboard.
Dashboard: the 30-day trends.
Search engine settings: how your pages show in search results.
Site settings: the contact details on your site.
Roles and access: who may read analytics.